Seabridge Gold Inc., (NYSE:SA, TSX:SEA), NI 43 101 May 7th, 2020
- Ksm (Kerr-Sulphurets-Mitchell) Prefeasibility Study And Preliminary Economic Assessment Update, Porphyry Cu, Au, Mo, Northwestern British Columbia,
- Resources Estimate Update
- Reserves Estimate in 2016 PFS

SUMMARY
1
INTRODUCTION
Seabridge Gold Inc.’s (Seabridge) Kerr-Sulphurets-Mitchell (KSM) Property
(the Property) involves the development of major gold-copper deposits located
in northwest British Columbia (BC) off Highway 37, approximately 65 km by air
north-northwest of the ice free Port of Stewart, BC. The Property is situated
within the coastal mountains of BC, approximately 30 km topographically
upgradient of the Alaska-BC border. KSM is one of the few undeveloped projects
in the world that has received its environmental approvals, these having been
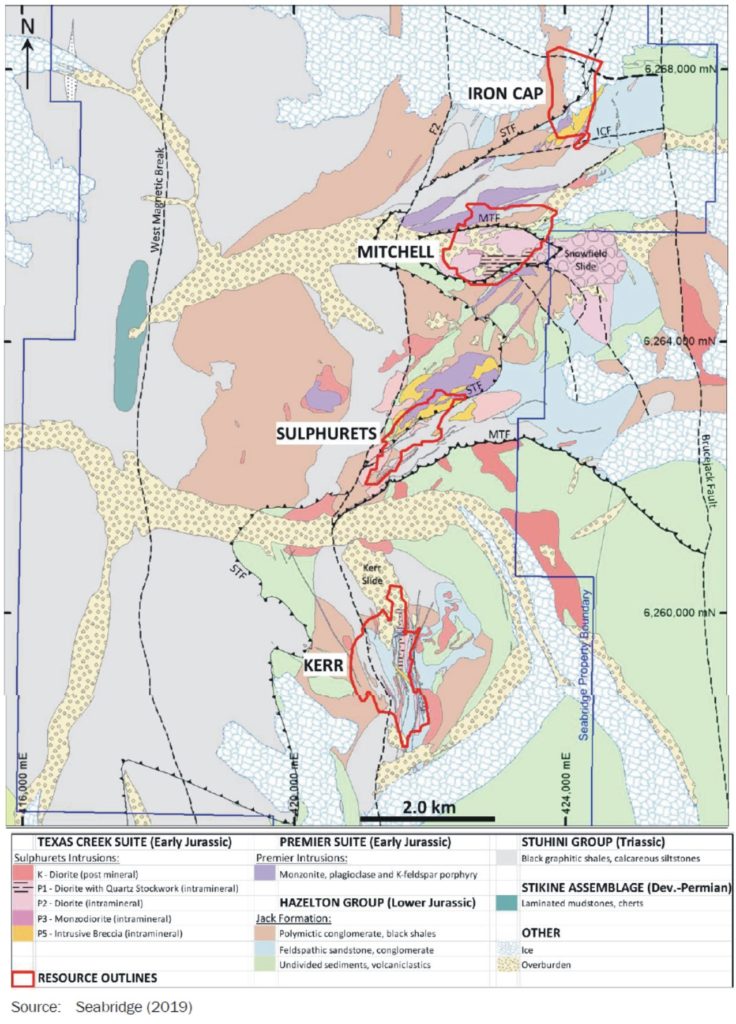
granted by both the Government of Canada and the Government of BC. KSM includes
four major mineralized zones, identified as the Mitchell, Kerr, Sulphurets, and
Iron Cap deposits. The deposits contain significant gold, copper, silver, and
molybdenum mineralization. Figure 1.1 is a panoramic view looking east towards
the aforementioned deposits.
In conjunction with the environmental approvals,
Seabridge also received early-stage construction permits for KSM from the
Province of BC in September 2014. The permits issued include:
- authority to construct and use roadways along Coulter Creek and Treaty Creek
- rights-of-way for the proposed Mitchell-Treaty Twinned Tunnel (MTT) alignment connecting KSM facilities
- permits for constructing and operating various camps required to support construction activities
- permits authorizing early-stage construction activities at the mine site and Tailings Management Facility (TMF).
Seabridge also received permits from the BC Government
in October 2016, which allows the construction of an exploration adit to
explore mineralization associated with the Deep Kerr deposit.
In this report, this “KSM (Kerr-Sulphurets-Mitchell)
Prefeasibility Study and Preliminary Economic Assessment Update, NI 43-101
Technical Report” (the Report), the KSM mine development has been evaluated
with two alternative studies that each evaluate different options for mine
development. The 2016 Prefeasibility Study (2016 PFS) evaluated mining mostly
by open pit method at a specified processing rate, while the 2020 Preliminary
Economic Assessment (2020 PEA) is an alternative study that leverages the
technical information of the previous studies and evaluates mine development
dominated by underground mining methods at a processing rate significantly
higher than that used in the 2016 PFS.
The results of the economic analyses for the 2016 PFS
and 2020 PEA represent forward-looking information that is subject to a number
of known and unknown risks, uncertainties and other factors that may cause
actual results to differ materially from those presented in this Report.
Forward-looking statements in this report include, but are not limited to,
statements with respect to future metal prices, the estimation of Mineral
Resources and Mineral Reserves, the estimated mine production and metals
recovered, the estimated capital and operating costs, and the estimated cash
flows generated from the planned mine production for the different development
options. The material factors or assumptions used to develop the
forward-looking information are identified in the relevant sections of this
Report.
2 KEY STUDY OUTCOMES
The 2016 PFS and the 2020 PEA are
stand alone studies. The results of the 2016 PFS remain valid and represent a
viable option for developing KSM, with the 2020 PEA assessing an alternative
development option at a scoping level. The 2020 PEA does not impact the 2016
PFS. The 2020 PEA is preliminary in nature and includes Inferred Mineral
Resources that are considered too speculative geologically to have the economic
considerations applied to them that would enable them to be categorized as
Mineral Reserves, and there is no certainty that the results of the 2020 PEA
will be realized. Mineral Resources that are not Mineral Reserves do not have
demonstrated economic viability.
The results of the 2020 PEA were
disclosed in Seabridge’s press release entitled “Updated PEA Study Enhances
Seabridge Gold’s KSM Project”, dated April 27th, 2020. The Report will be filed
in support of the disclosure of the 2020 PEA results.
2020 PRELIMINARY ECONOMIC ASSESSMENT
Wood Canada Limited (Wood) and the following
independent consultants have prepared an updated Preliminary Economic
Assessment study (the 2020 PEA):
The 2016 PFS envisaged a combined open pit/underground
block caving mining operation that is scheduled to operate for 53 years. During
the initial 33 years of mine life, the majority of ore would be derived from
open pit mines, with the tail end of this period supplemented by the initial
development of underground block cave mines. Ore delivery to the mill during
Year 2 to Year 35 is designed to be maintained at an average of 130,000 t/d.
After depletion of the open pits, the mill processing rate would be reduced to
just over 95,000 t/d for 10 additional years before ramping down to just over
60,000 t/d for the remaining few years of stockpile reclaim at the end of the
mine life. Over the entire 53-year mine life, ore would be fed to a flotation
and gold extraction mill. The flotation plant would produce a
gold/copper/silver concentrate for transport by truck to the nearby sea port
for shipment to Pacific Rim smelters. Extensive metallurgical testing confirms
that KSM can produce a clean concentrate with an average copper grade of 25%
with a high gold and silver content, making it readily saleable. A separate
molybdenum concentrate and gold-silver doré would also be produced at the KSM
processing facility.
All dollar figures presented in this report are stated
in US dollars, unless otherwise specified. The 2016 PFS concluded:
- the estimated Proven and Probable Mineral Reserves as of July 31, 2016 are 38.8 Moz
of gold and 10.2 Blb of copper (2.2 Bt at an average grade of 0.55 g/t gold and
0.21% copper per tonne). - projected initial capital costs are US$5.0 billion and sustaining capital costs are
US$5.5 billion estimated to a +25%/-10% level of accuracy and incorporate
substantial enhancements to meet environmental improvements that were committed
to in the environmental assessment (EA) review process - the 2016 Base Case after-tax NPV at a 5% discount rate is US$1.5 billion with an IRR of
8% and payback period is approximately 6.8 years of a 53-year operating mine
life, using three-year average price assumptions of US$1,230.00/oz gold,
US$2.75/lb copper, US$17.75/oz silver, US$8.49/lb molyebdenum and a foreign
exchange rate of US$0.80 per Cdn$1.00 - overall, the 2016 PFS confirmed that KSM is an economic project with an unusually long
life in a low-risk jurisdiction.
2020 PRELIMINARY ECONOMIC ASSESSMENT
Wood Canada Limited (Wood) and the following independent consultants
have prepared an updated Preliminary Economic Assessment study (the 2020 PEA):
- MMTS
- Golder
- KCB
- BGC
- Brazier
- ERM.
The 2020 PEA has been prepared as an alternative
option to the 2016 PFS for the KSM development. The 2020 PEA was undertaken to
evaluate a different approach to mine development by emphasizing low cost block
cave mining early in the production plan and reducing the size of the open
pits, which reduces the surface disturbances in the re-designed mine
development. The 2020 PEA assesses the potential impacts of incorporating
higher grade Inferred Mineral Resources delineated at Iron Cap and Deep Kerr
into the mine design, and increasing the annual average mill throughput from
130,000 t/d envisioned in the 2016 PFS to 170,000 t/d in the 2020 PEA.
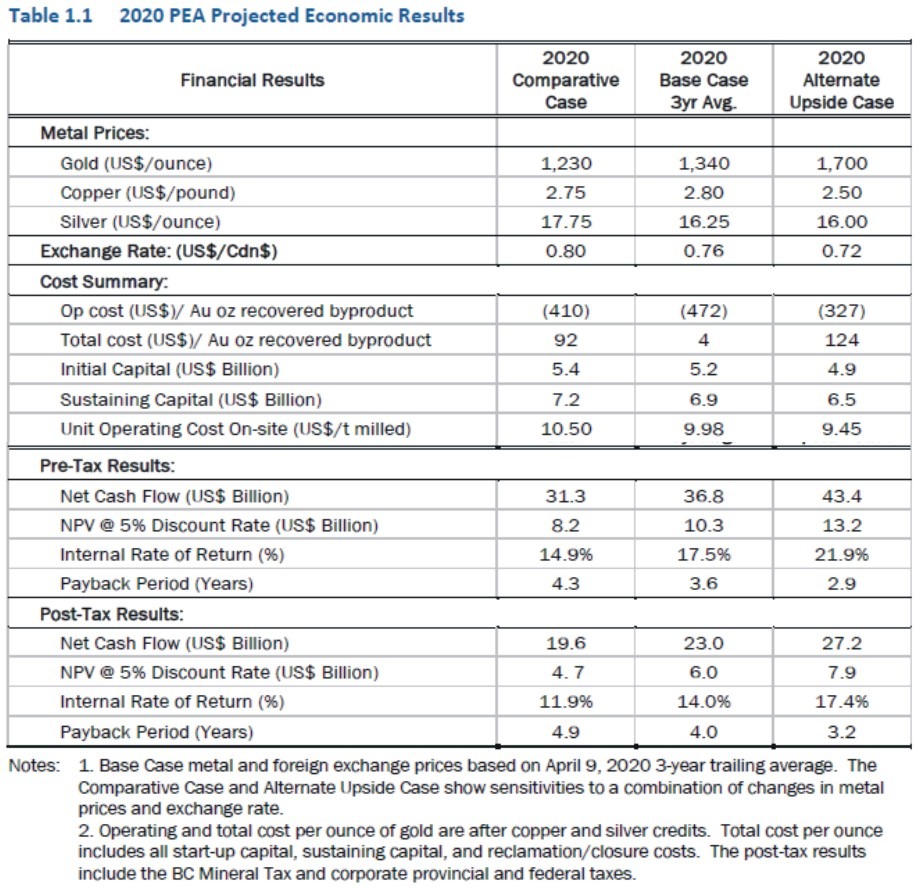
The key 2020 PEA outcomes for the projected economic
results are presented in Table 1.1. The 2020 PEA show improvements over the
2016 PFS in unit operating costs, net cash flow, NPV, IRR and project payback
by producing a higher percentage of mill feed through underground mining, and
processing the mill feed at a higher plant throughput rate. Annual gold and
copper production in the 2020 PEA increase over those shown in the 2016 PEA
through the benefit of applying an improved variable cutoff strategy to early
mining, improved mine sequencing and achieving this with reduced initial and
sustaining capital.
The material factors or assumptions used to develop
the forward-looking information in the 2020 PEA, as well as the material risk
factors that could cause actual results to differ materially from the
forward-looking information are more fully described in Section 24 and 25 of
the Report. A portion of the Mineral Resources in the 2020 PEA mine plans,
production schedules, and cash flows include Inferred Mineral Resources, that
are considered too speculative geologically to have the economic considerations
applied to them that would enable them to be categorized as mineral reserves,
and there is no certainty that the 2020 PEA will be realized. Due to the
conceptual nature of the 2020 PEA, none of the Mineral Resources in the 2020
PEA have been converted to Mineral Reserves and therefore do not have
demonstrated economic viability.
3 PROPERTY DESCRIPTION AND LOCATION
The Property is located in the coastal mountains of
northwest BC at a latitude and longitude of approximately 56.50° north (N) and
130.30° west (W), respectively. The Property is situated approximately 950 km
northwest of Vancouver, BC; 65 km by air north-northwest of Stewart, BC; and 21
km south-southeast of the former Eskay Creek Mine. The proposed pit areas lie
within the headwaters of Sulphurets Creek, which is a tributary of the Unuk
River, which flows into the Pacific Ocean through Alaska. The proposed TMF will
be located within the tributaries of Teigen and Treaty creeks. The Teigen and
Treaty creeks are tributaries of the Bell-Irving River, which is itself a major
tributary of the Nass River. The Nass River also flows to the Pacific Ocean
through the northwestern portion of British Columbia, entirely within Canadian
jurisdiction. Figure 1.2 is a general location map of the Property.
The Property comprises four discrete claim blocks. The
claim blocks are referred to as:
- the KSM claims
- the Seabee claims
- the Tina claims
- the Treaty Creek Switching
- Station claims
The four KSM claim blocks include 79 mineral claims
(cell and legacy) and 2 mining leases with a combined area of 40,784.97 ha.
There are also 17 KSM placer claims held by KSM Mining ULC covering part of the
KSM claims. The placer claims secure rights in a historically designated placer
district. The Claim Group Inc. (TCG) acts as agent on behalf of Seabridge with
respect to maintaining all pertinent records associated with the Property
tenures. All claims and leases are in good standing under the Mining Tenure
Act of BC and are recorded as owned 100% by KSM Mining ULC, a wholly owned
subsidiary of Seabridge.
Annual holding costs for all leases and claims vary by
year depending on whether the fees are paid in cash or the value of work
completed on developing the claims is used in lieu of a cash payment. Over the
next five years, the annual cash holding costs to keep the claims and leases
valid range between Cdn$450,000 to Cdn$970,000. Those estimated costs can be
reduced significantly if work expenditures are applied in lieu of cash fees. No
additional permits are required to address the recommendations in this report;
part of the expenditures for that work can be applied in lieu of cash fees.
Seabridge believes they have addressed all issues to secure access, mineral
title, and ability to perform work on the property and are not aware of any risks,
other than those identified in this Report, that could materially affect
proposed work plans.
- the Seabee claims
- the Tina claims
- the Treaty Creek Switching
4 GEOLOGICAL SETTING AND MINERALIZATION
The Property lies within “Stikinia”, a long-lived volcanic island-arc terrane that was accreted onto the Paleozoic basement of the North American continental margin in the Middle Jurassic.
Early Jurassic sub-volcanic intrusive complexes are
common in the Stikinia terrane, and several host well-known precious- and
base-metal-rich hydrothermal systems. These include copper-gold porphyry zones
such as Galore Creek, Red Chris, Kemess, Mt. Milligan, and KSM.
The Kerr deposit is centered on an Early Jurassic,
north-south trending, steep westerly dipping tabular intrusive complex.
Drilling demonstrates that the recognized mineralized system has an overall
strike extent of 2,400 m, a width of approximately 800 m, and a vertical extent
of at least 2,200 m. Deep drilling since 2012 has identified two sub-parallel,
north-south trending, steep west-dipping mineralized zones approximately 1,700
m long that appear to coalesce near the topographic surface. The west limb is
up to 500 m thick, while the east limb is up to 300 m thick. After significant
deep drilling was completed at the Kerr deposit, an updated geological
interpretation and subsequent updated Mineral Resource model were completed.
That new model forms the basis for the 2019 Mineral Resources and Mineral
Reserves. Approximately 223 diamond core holes totaling about 85,000 m of
drilling data were used to construct the Kerr block model used for this Report.
Sulphurets is a structurally complex deposit
intersected by numerous east-vergent faults associated with the mid-Cretaceous
Skeena fold and thrust belt. The deposit is composed of stacked thrust fault
panels made up of Upper Triassic Stuhini Group and Lower Jurassic Hazelton
Group volcano-sedimentary strata that are intruded by a number of dykes and
stocks. The majority of mineralization occurs in the “Lower Panel”, that was
historically divided into several discrete mineralized zones, including, from
southwest to northeast: the Canyon zone, Breccia Gold zone, and Raewyn
Copper-Gold zone. The main body of the Sulphurets deposit has a lensoidal
geometry, dipping approximately 30 degrees to the northwest with a horizontal
extent of 2,200m, down dip extent of 550 m, and a true thickness of up to 330
m. Approximately 139 core holes totaling about 45,000 m were used to construct
the Sulphurets block model used for this Report.
The Mitchell Zone (Figure 1.4) is underlain by
foliated, schistose, intrusive, volcanic, and clastic rocks that are exposed in
an erosional window below the shallow north dipping Mitchell Thrust Fault
(MTF). Mineralization at the Mitchell deposit is genetically and spatially
related to the Early Jurassic Mitchell intrusive complex, which is composed of
Sulphurets (Texas Creek) suite diorite, monzodiorite, and granodiorite stocks
and dykes. The intrusive complex cuts sedimentary and volcanic rocks of the
Upper Triassic Stuhini Group and sandstones, conglomerates, and andesitic rocks
of the Lower Jurassic Jack Formation (basal Hazelton Group). The Mitchell
complex has been subdivided into three major intrusive phases. The successive
intrusive phases were accompanied by the development of different hydrothermal
assemblages, veining and mineralization. The Mitchell deposit features many
characteristics typical of gold-enriched calc-alkaline porphyry copper
deposits. Metals, chiefly gold and copper are generally at low concentrations,
finely disseminated, stockwork or sheeted veinlet controlled and pervasively
dispersed over hundreds of metres. Grades diminish slowly over large distances,
distinct from the Sulphurets and Kerr zones. The basis for Mitchell Mineral
Resources is the block model that was used in the 2016 PFS (Tetra Tech, 2016).
That model was constructed using drilling data collected through 2011. Since
that model was completed, 23 holes were drilled within the Mitchell resource
area, although only 8 holes intersected estimated Mineral Resources based on
the end-of-year 2011 block model. Grade comparisons between the 8 new holes and
the end-of-year 2011 Mitchell block model showed no material differences
between the new holes and the estimated block grades.
The Iron Cap deposit is the northernmost porphyry gold-copper-molybdenum
deposit in the KSM district, and occurs structurally above the Mitchell
deposit, in a panel of rocks located between the Mitchell Thrust Fault and
Sulphurets Trust Fault. The deposit is hosted by an Early Jurassic intrusive
complex that is roughly contemporaneous with intrusions located at the Mitchell
and Kerr zones. The intrusive complex is composed of multiple intrusion and
breccia phases, the earliest of which is a pre-mineral diorite. A second dioritic
phase located in the northwestern portion of the deposit is thought to be
syn-mineral and is spatially associated with some of the highest gold and
copper grades observed at Iron Cap. Mineralized hydrothermal breccias are
significantly more abundant and voluminous at Iron Cap than at Mitchell,
Sulphurets, and Kerr. The Iron Cap mineralized zone forms a tabular body
striking roughly north-south, dipping approximately -60 degrees to the west.
The deposit has dimensions of approximately 1,500 m along strike, 1,500 m down
dip, and up to 800 m in thickness. Mineralization remains open down dip. The
Iron Cap grade model was updated following the completion of the 2018 drilling
campaign. A total of 99 diamond core holes totaling about 62,000 m were used in
the update.
5
MINERAL RESOURCES
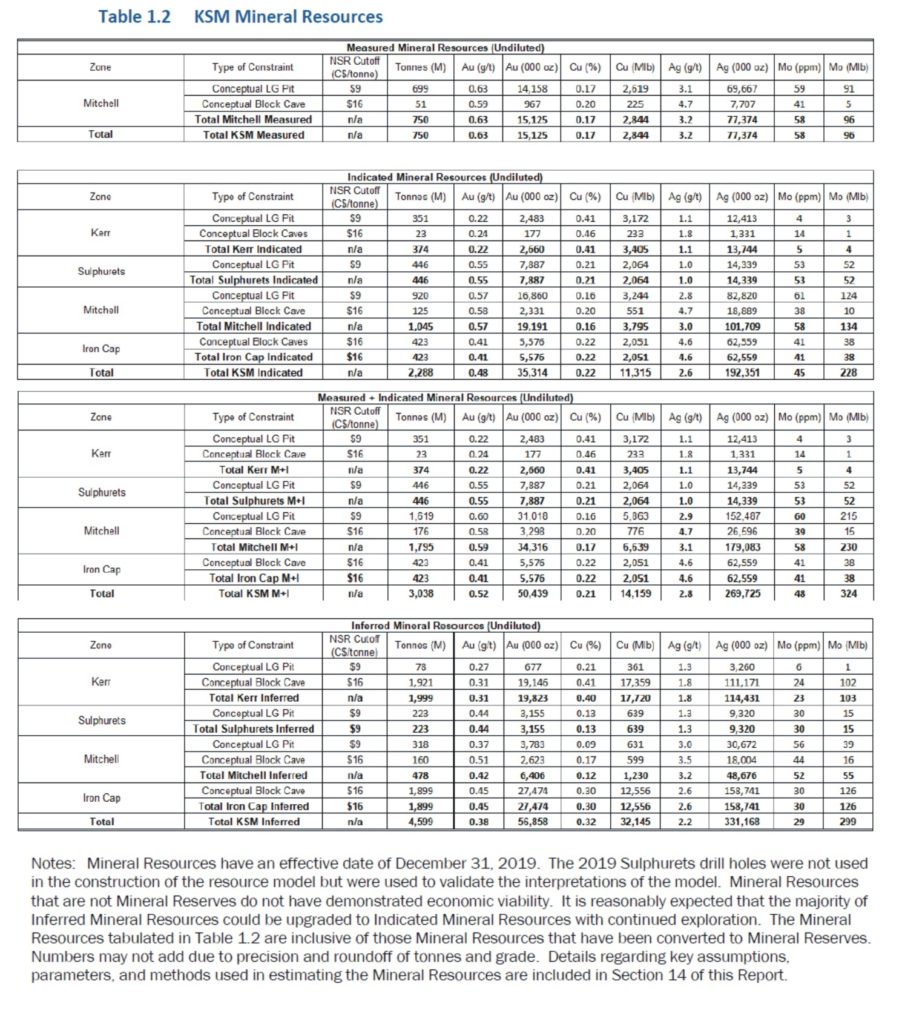
The 2019 Mineral Resource estimate is the current and only Mineral
Resource estimate used in this Report.
Mineral Resources were estimated for the Property by
Resource Modeling Inc. (RMI). The four mineralized zones, Kerr, Sulphurets,
Mitchell and Iron Cap, were modeled within a single block model using 25m x 25m
x 15m blocks. As more understanding was gained after each annual drilling campaign,
individual block models were created for each area. Grade interpolation
parameters have also evolved over time, reflecting changes required for
modeling deeper mineralization intersected below the Kerr and Iron Cap
deposits. A variety of basic descriptive statistics and spatial analyses were
completed for each area upon the completion of annual drilling campaigns. These
investigations include the generation of grade distribution tables, grade
histograms, cumulative probability plots, grade box plots, grade contact plots,
down-hole variograms, and directional variograms. In addition, new drill hole
results were typically compared against the previous grade model to assess
model performance.
RMI established the Mineral Resources for the various
KSM mineralized zones using constraining conceptual open pit and block cave
shapes which were used to establish reasonable prospects for eventual economic
extraction as outlined in the CIM Definition Standards for Mineral Resources
and Mineral Reserves (CIM, 2014). The following gold, copper, silver, and
molybdenum metal prices were used for determining block NSR values,
US$1,300/oz, US $3.00/lb, US $20.00/oz, and US $9.70/lb, respectively. Open pit
and underground mining costs of Cdn$1.80/tonne and Cdn$6.00 to Cdn$7.00/tonne
were used to establish conceptual open pit and underground resource shapes,
along with a processing and G&A cost of Cdn$9.00/tonne.
The conceptual open pit and underground mining shapes
were generated for each resource area based on calculated block model NSR
values. The NSR values were generated for each deposit. MMTS generated
conceptual pits for the Kerr, Sulphurets, and Mitchell deposits using
MineSight® software and Lerchs-Grossmann algorithms. Golder developed
conceptual block cave footprints using the block NSR values and Geovia’s PCBC™ Footprint
Finder software. The footprint polygons were extruded vertically based on
guidance from Golder.
The draw point extraction elevations were extruded
vertically to create 3D solids that were used for resource tabulation.
Conceptual caves were clipped against surface topography (Iron Cap) or
conceptual resource pits (Kerr and Mitchell). Mineral Resources are determined,
at Cdn$9 and Cdn$16 NSR cutoffs for open-pit constrained and underground mining
constrained resources, respectively.
Table 1.2 summarizes the estimated Measured,
Indicated, and Inferred Mineral Resources for each zone.
6 MINERAL RESERVE ESTIMATE
Mineral Reserves estimate was In the 2016 PFS
7 MINE PRODUCTION PLAN
During the initial 33 years of
mine life, the majority of ore is derived from open pits, with the tail end of
this period supplemented by the initial development of underground block cave
mines. After Year 1 ramp up, ore delivery to the mill from Year 2 to Year 35 is
designed to be maintained at an average of 130,000 t/d. After depletion of the
open pits, the mill processing rate will be reduced to about 96,000 t/d for 10
additional years, before ramping down to just over 61,000 t/d. The change in
throughput matches the production levels from the block cave with appropriate
ramp ups and ramp downs applied. The remaining few years use stockpile reclaim
to supplement the declining production from the block caves at the end of the
mine life.
The topographic relief in the areas of the open pits, block cave mines,
and the Rock Storage Facilities (RSFs) requires specific geotechnical
consideration. Conservative designs, alternative/mitigating scenarios, and
extra data and analyses have been included in the mine designs.
Potential geohazards have been identified in the area
of the proposed open pits, block cave mine, RSFs, roads, and other
infrastructure; designs include the mitigation of geohazards such as avalanche
control, provision of avalanche run-out routes, barriers, and avalanche area
and slope hazard avoidance as appropriate.
The mining progression is designed to build RSFs in
lifts (bottom-up construction) to consolidate the foundations and reduce
downslope risks. Final RSF configurations are designed with terraces at “as
dumped” angle of repose, with flat benches between terraces. The overall slope
angle is between 26° and 30° to provide the ability for re-sloping to accommodate
the end land use and reclamation plan.
Ore is mined from Mitchell open pit from Years 1 to 24. Mitchell transitions to block cave mining as the Mitchell pit is mined out. Ore is mined from Sulphurets open pit from Years 1 to 17. Kerr open pit supplements block cave mining from Year 25 to Year 34, and during these years, ore will be transported by an overland conveyor and rope conveyor system starting at the Kerr pit. Mitchell block cave is estimated to have a production ramp-up period of six years, steady state production at 20 Mt/a for 17 years, and then ramp-down production for another 7 years. Iron Cap is estimated to have a production ramp-up period of four years, steady state production at 15 Mt/a for 10 years, and then ramp-down production for another 9 years. The underground pre-production period would be six years, with first underground ore production from Mitchell and Iron Cap in Years 23 and 32, respectively. Figure 1.6 shows the 2016 PFS Open Pit LOM general arrangement.
Dodaj komentarz